This is GlucoseBar


The largest ever update to GlucoseBar is here!
Introducing Zen Mode, customizable menu bar data, dynamic glucose colors, localizations and AID integrations!
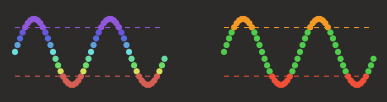
Menu Bar Customizations
Enable Zen Mode to see a simple colored dot when you
don't want to obsess over the numbers.

Color individual elements with either dynamic glucose
color or static glucose color

Chart
When you click the menu bar, you are met by the
beautiful chart.
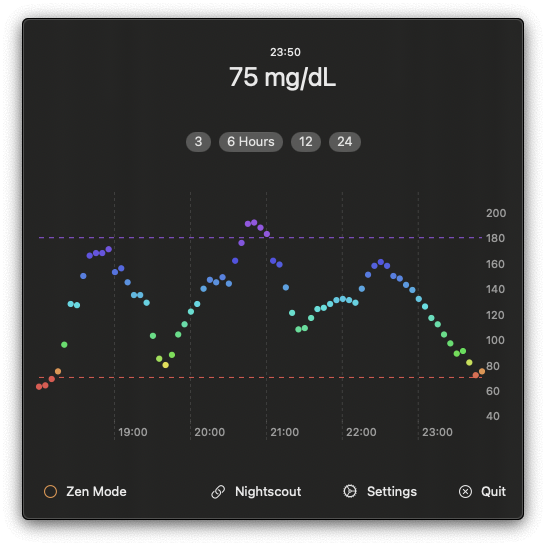
Here you will see your glucose data plotted over the
time slot you have selected. You can choose between 3,
6, 12 and 24 hours.
In settings you can change between the Dymanic Glucose
Color or a Static Glucose Color for the chart.
AID Integration
When you enable the AID integration (available with the Nightscout CGM connection), additional information becomes available to you. This currently works with oref based systems such as Trio, OpenAPS, and AAPS.
Show your IOB, COB, Loop Status and Eventual Glucose in
the menu bar

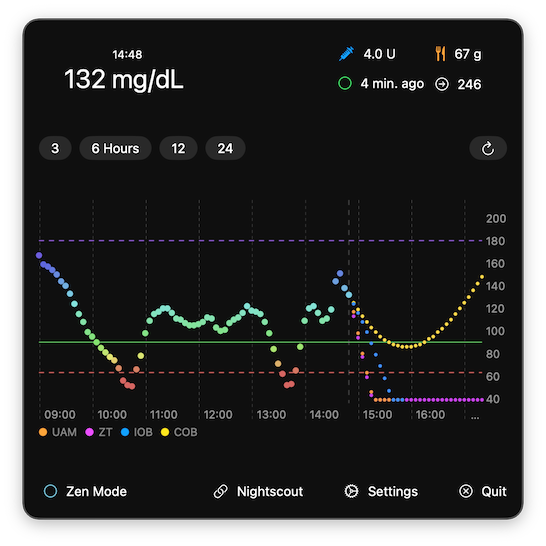
Show them on the Chart too!
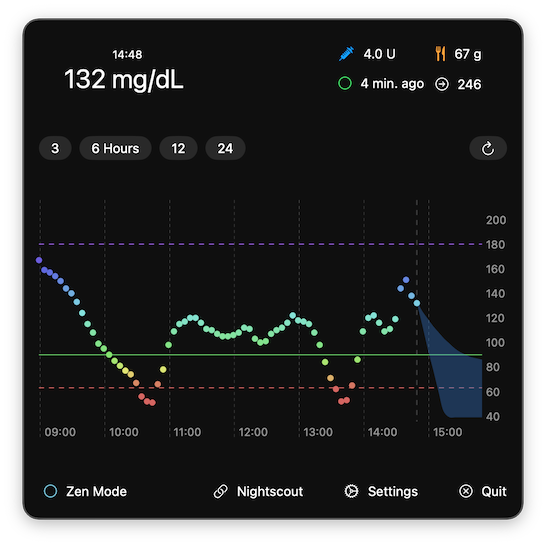
You can even enable the forecast, either as Cone of
Uncertainty, or the more traditional lines
Did I mention GlucoseBar is completely open source and respects your privacy too?